
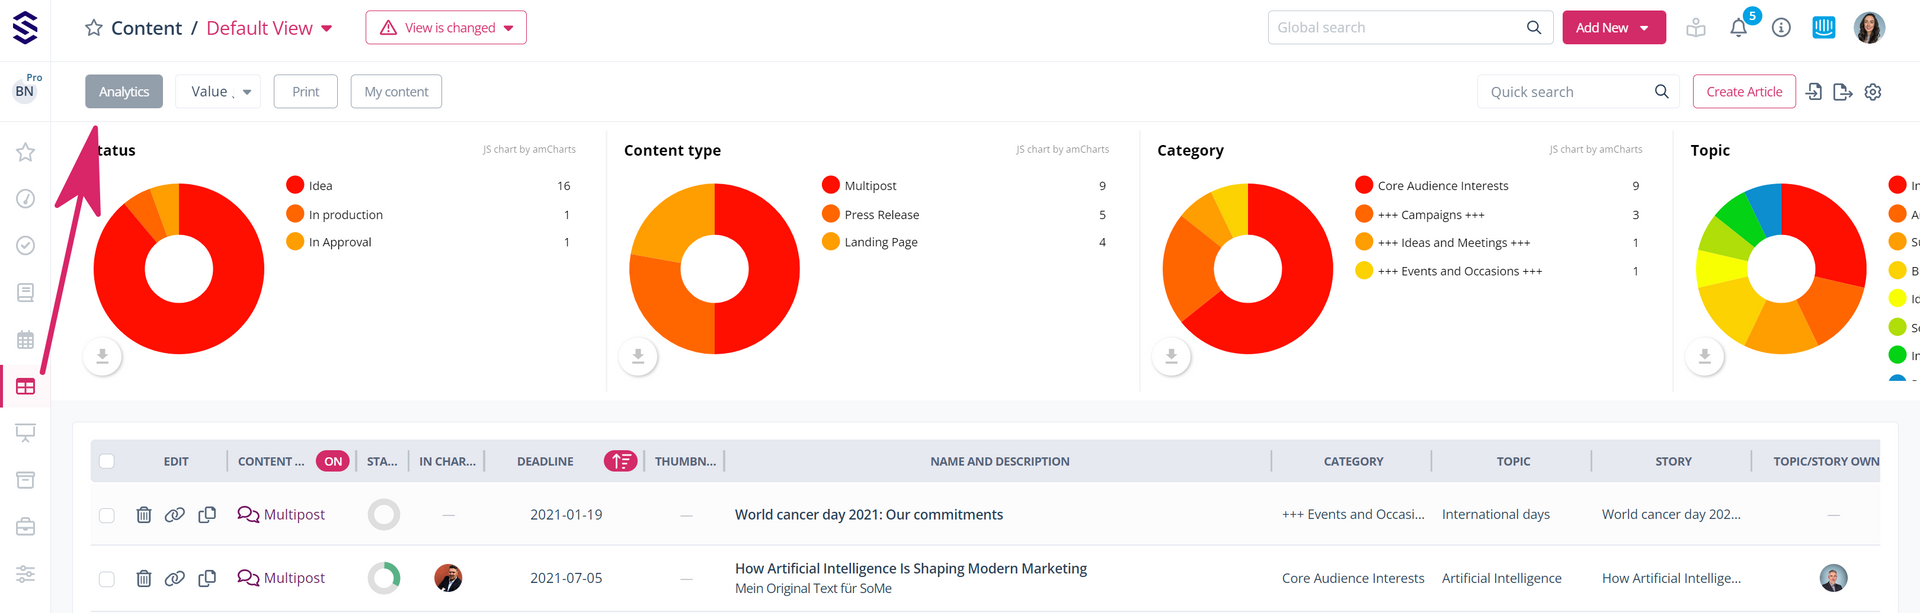
From the ONE+ version onwards, in addition to the filter functions and column customisation, you also have a whole range of donut charts available in the Content area, which you can compile individually and display as required.
You can display the diagrams by clicking on "Analysis" at the top left of your content view.
- Under "Settings" (the configuration wheel at the top right) you can select the columns for which you want to display the charts
- The left set of fields here defines the analysis charts, while the right set defines the column display
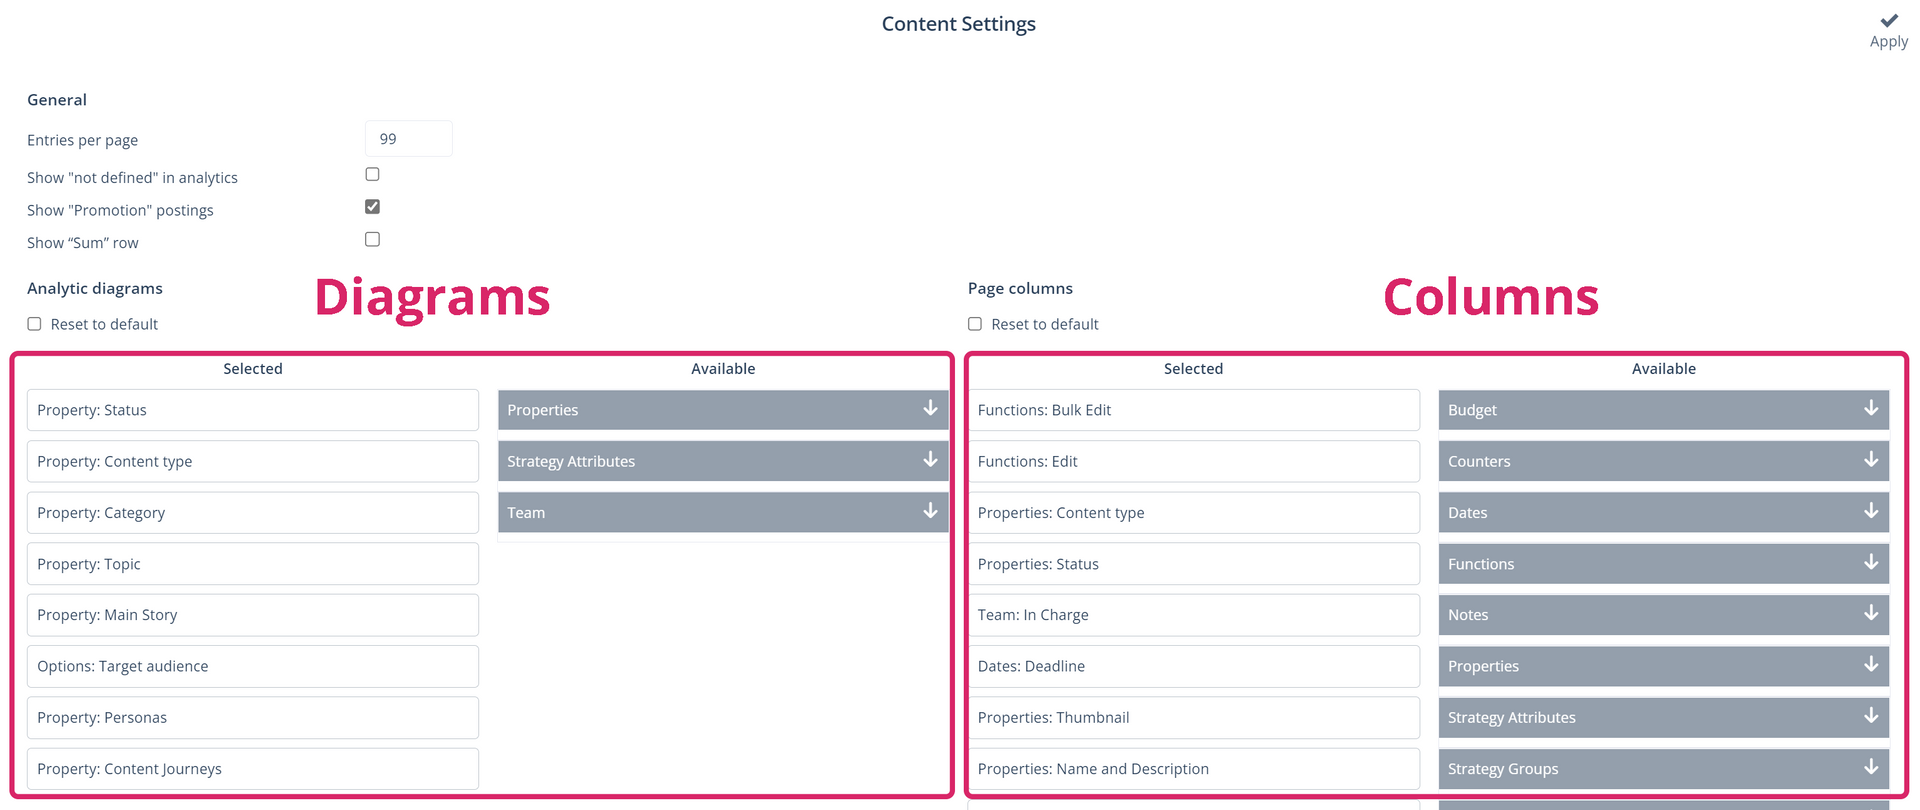
- On the right-hand side of the window, select the parameters about which you want to obtain information. Open the categories by clicking on the options in the "Available" column and move the desired parameter to the "Selected" column. The list order in this column is related to the order in which the parameters will appear in the respective area

- Repeat the previous step until you have all the parameters you want and click on "Apply" to save your changes