In the Reports module, you have access to 3 different widget categories:
- general widgets for analyzing articles, stories, and assigned strategy parameters
- social media widgets for analyzing your social media activities
- community widgets for analyzing your community management activities and your community’s engagement
This article provides an overview of the Community Management widgets available in the Reports module. To learn how to add tabs and widgets in the Reports module, switch to this article.
Prerequisites:
- You use Community Management (paid add-on for Pro licenses)
- The Community Management integration is enabled for your Social Media channels.
- The option to import data is enabled for your Social Media channels.
Ensure that the Reports module features are available to all desired user groups. You can find the corresponding permissions under Project Settings > Users > Groups > Reports.
Available Community Management Widgets
The following widgets are available in the Community category of the Reports module:
- Community summary
- Total number of conversations per channel
- Total number of conversations over time
- Average conversation time
- Average response time
Widget: Community Summary
The Community summary widget provides an overview of your community activity during a selected time period. The widget consists of 4 metrics for a quick overview of new conversations, conversations awaiting response (in %), the average response time and the average conversation time.
If you select a comparison period in the filters, the change compared to this period is also displayed next to each metric: green indicates improvements, while red indicates declines.
The following filters are available in the widget:
- Time Period (optionally including a comparison period)
- Community Channel
- Action Type
- Tags
- Assignee

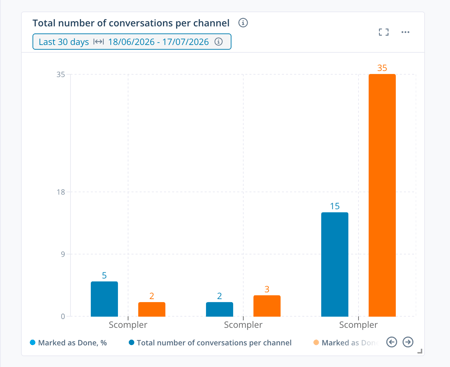
Widget: Total Number of Conversations per Channel
The Total number of conversations per channel widget shows the number of new conversations initiated in each channel during the specified time period.
When you hover over a column, a flyout opens showing the percentage of conversations that have been marked as completed.
If you select a comparison period in the filters, an additional orange column showing the values for the comparison period is displayed next to each channel's column.
The following filters are available in the chart:
- Time Period (optionally including a comparison period)
- Community Channel
- Action Type
- Tags
- Assignee
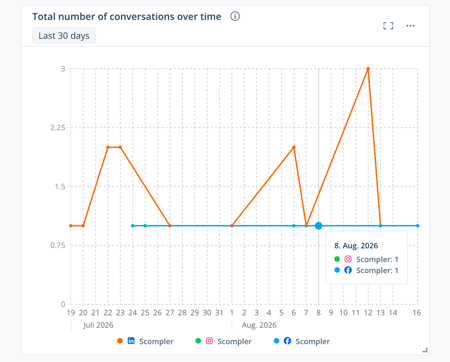
Widget: Total Number of Conversations Over Time
The Total number of conversations over time widget shows how the number of conversations has changed over a selected time period.
When you hover over a data point, a flyout opens showing the exact date and the number of conversations per channel.
The following filters are available in the line chart:
- Time Period
- Community Channel
- State
- Action Type
- Tags
- Assignee
Widget: Average Conversation Time
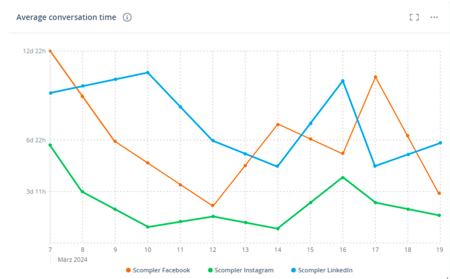
The Average conversation time widget shows how the average duration of conversations has changed over a selected time period. Conversation duration refers to the time between the first message and the point at which the conversation was marked as completed.
When you hover over a data point, a flyout opens showing the exact date and the conversation duration per channel.
The following filters are available in the line chart:
- Time Period
- Community Channel
- Action Type
- Tags
- Assignee
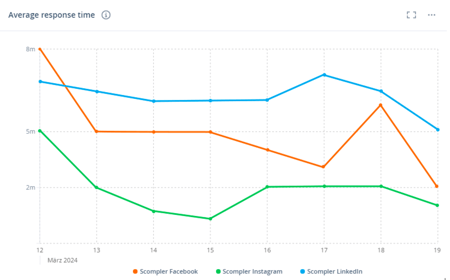
Widget: Average Response Time
The Average response time widget shows how the response time for conversations has changed over a selected time period. Response time refers to the time between receiving a message and the point at which it was answered.
When you hover over a data point, a flyout opens showing the exact date and the response time per channel.
The following filters are available in the line chart:
- Time Period
- Community Channel
- State
- Action Type
- Tags
- Assignee