NOTE: Please note that to see data in your reports, you need to activate the option to import data for your connected social media channels and Community Management (CM) must be enabled. You can find out how to activate data imports in the connection process here. Here, you will learn how to activate CM for your channel.
Please also note that data generated by your social media channels is only available in the reports after integration. Data is not imported retroactively after you've made the connection.
Add new widgets
In the Reports area, click on the cogwheel at the top right and select "Add new widget". Then, navigate to the "Social media" tab and select the appropriate widget.

You have the option to select widgets that show how well your audience engagement is going as well as your own performance in Community Management. You can set the time period for these metrics in the global filter which is located in the top bar of the tab. Additionally, each widget lets you choose a different timeframe from the one specified in the global filter. You can also filter by channel, specific action type, and actions tagged in CM or assignee. To apply these filters individually, open the "Edit widget" option via the three-dot menu.
The Community Management widgets explained
The "Community summary" widget gives you an overview of your interactions, including incoming conversations, how many are awaiting a response, your average response time, and how long conversations typically last.

TIP: Use the tooltips next to each metric for more detailed information on the measured metrics.
The widget "Total number of conversations per channel" shows the number of new conversations initiated on each channel during the specified date range. It also highlights the percentage of conversations which were marked as completed.

The widget "Total number of conversations over time" graphically shows the increase and decrease in conversations on the respective channels over time. You can move the mouse pointer over the graphs to display the number of conversations on the various channels at the respective point in time.

The widgets "Average conversation time" and "Average response time" show you the variations of your average conversation duration and the time until a new conversation gets a response. Here, you can also move the mouse pointer over the graphs to display the numbers for a particular point in time.

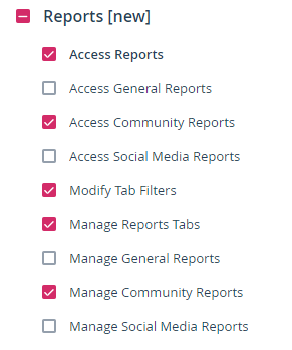
NOTE FOR ADMINISTRATORS: For Community Management widgets to be managed and displayed by users, this must be activated in the user group settings: