In Scompler, you can create additional tabs and widgets on your dashboard and in the Theme and Story cards, in addition to the text widgets, to store information or important data for your team in a central and accessible place.
HTML Widgets
HTML widgets are used to embed an external page into the Scompler Dashboard.
Note: Only pages that provide the iframe can be embedded.
Click on the configuration wheel, add a new widget and select the HTML widget. In this widget, you can format text, add images and create hyperlinks. You can also add an iFrame by adding it in the displayed field.

Tip: You can embed a Google Trends view, for example, by clicking "< >" and copying the script:

URL widgets
URL widgets allow you to add data from an external page (charts, designs, videos, media etc.) by simply copying the embed url and pasting it into Scompler. Click on the configuration wheel, add a new widget and select "URL embedding". In this widget, you can also add a description before and after the URL, format the text, add images and create hyperlinks.

Heads-up: Please note that some sites use the code "HTTP X-Frame-Options" to block iFrames and to ensure that their content is not embedded in external pages. In this case, Scompler will not show an iFrame, but the url you entered.
RSS Feed
The abbreviation RSS stands for "Really Simple Syndication". The RSS feed works like a news ticker and provides the user with short blocks of information.
To add this widget, click on the configuration wheel again, select the widget "RSS Feed" and add the link to the feed you want to see here.
Note: To add an RSS feed, you should first know the exact feed URL. and enter it in the widget.

Analytics
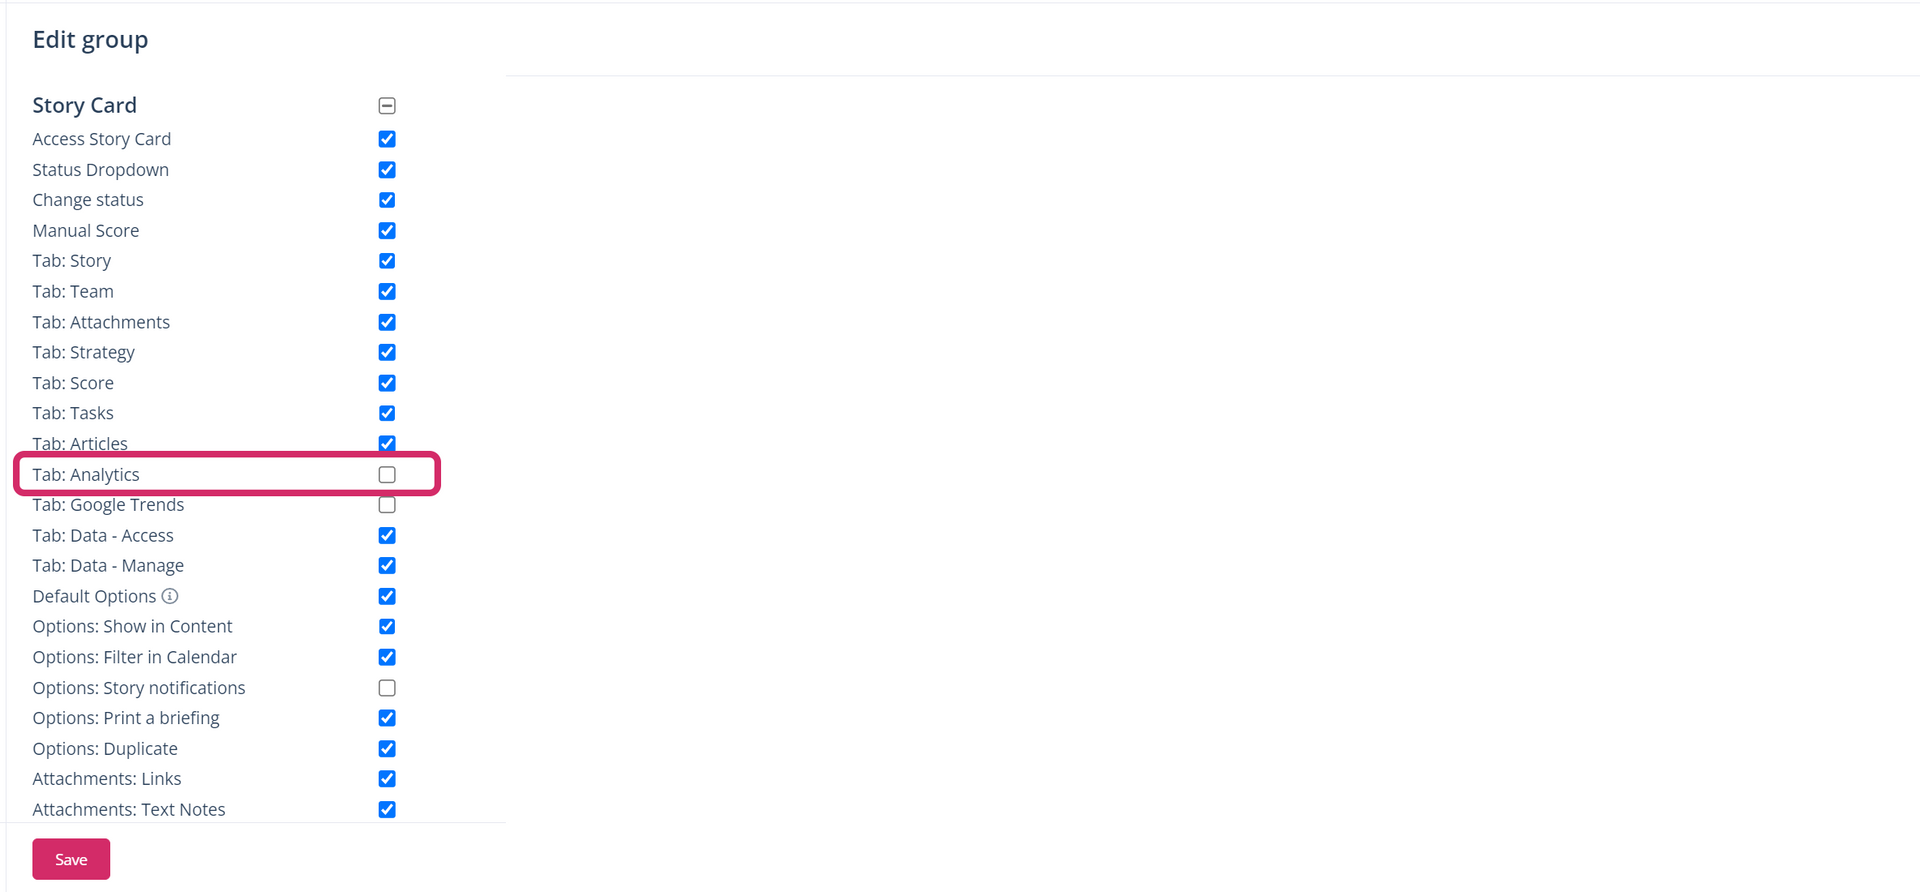
In Scompler, you can access performance KPIs of the posts published in each topic and/or story. You can also view this data in a tab on your dashboard. To do this, click the configuration wheel again and select the Topic/Story analytics widget. Then select the story or topic for which you want the performance data to be displayed:

Note: This tab is already available in the Topic and Story cards if the administrator enables it user group permissions. You will find this tab under "Data":