How do I keep track of my budget and costs?
Use the Budget area to get an overview of your planned budgets as well as your actual costs at any time on the category, topic, story and article levels.
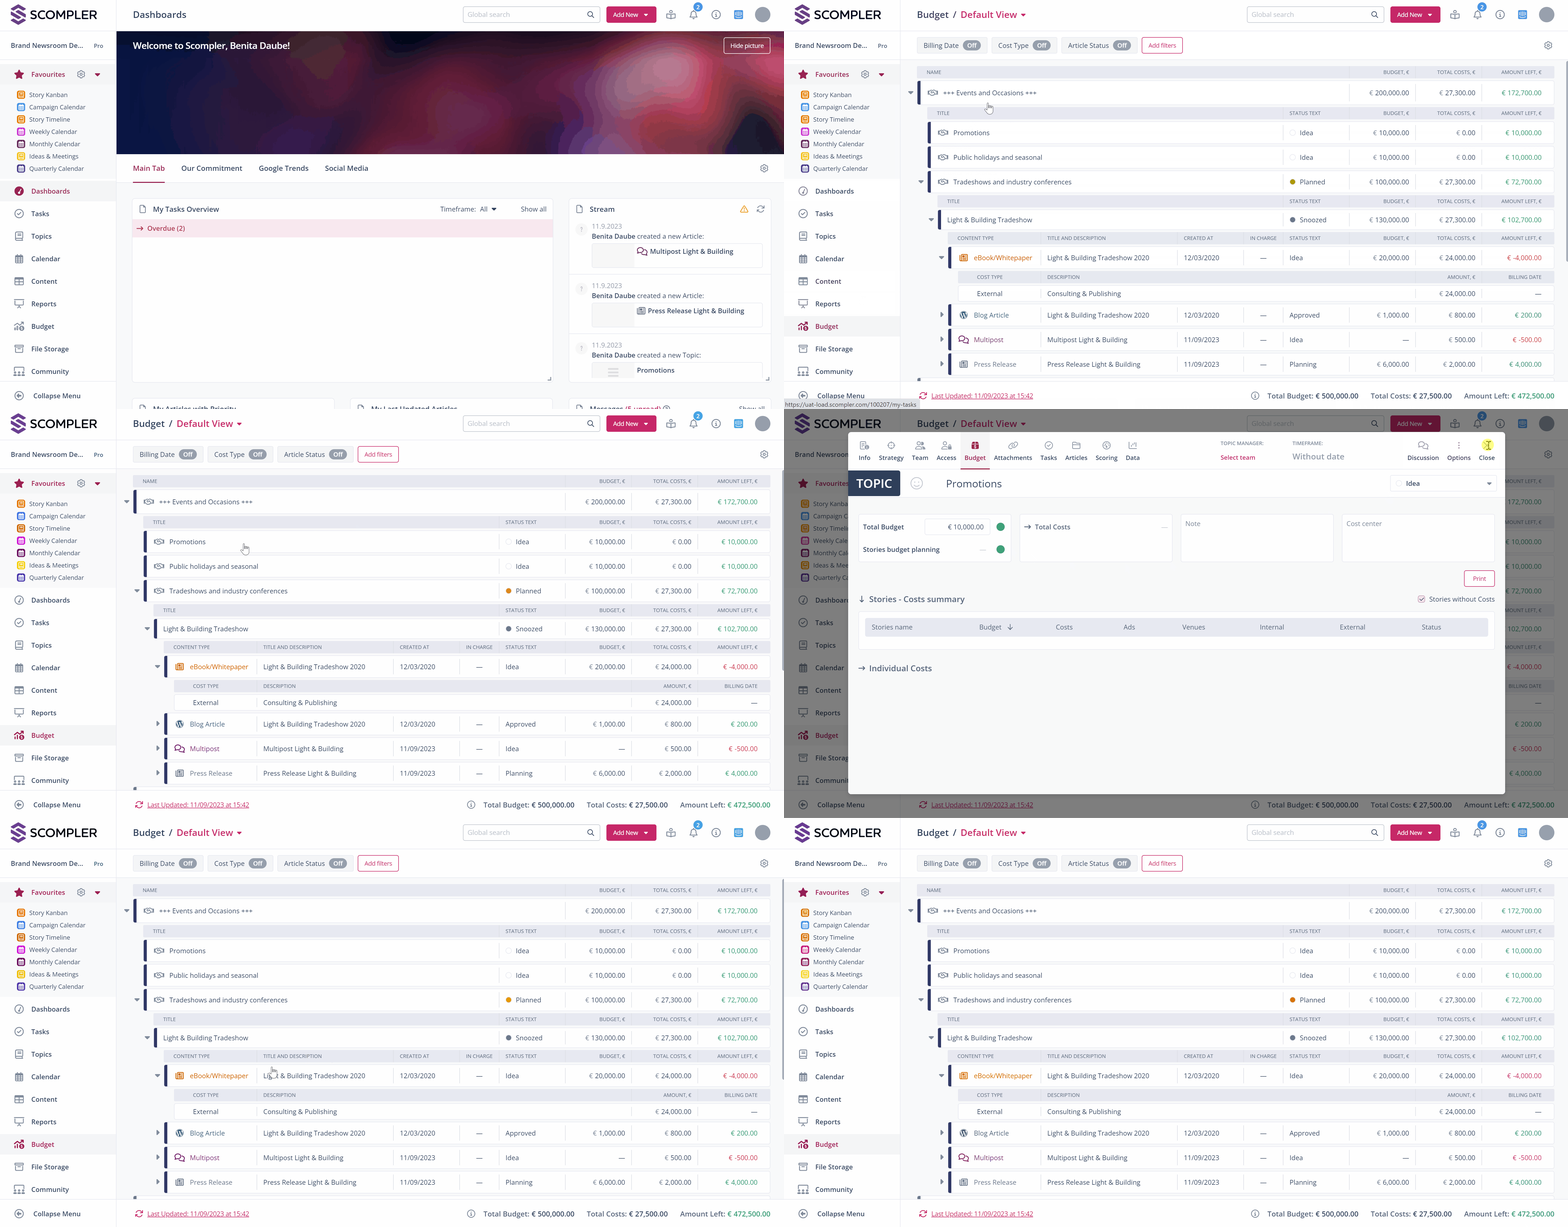
You can find the Budget in the main menu on the left side of your Scompler window. In order to make it easier to navigate, the overview has the same structure as the “All topics” view. Click on each item to open the “Budget” tab of the category, topic, story or article card:
Key figures explained
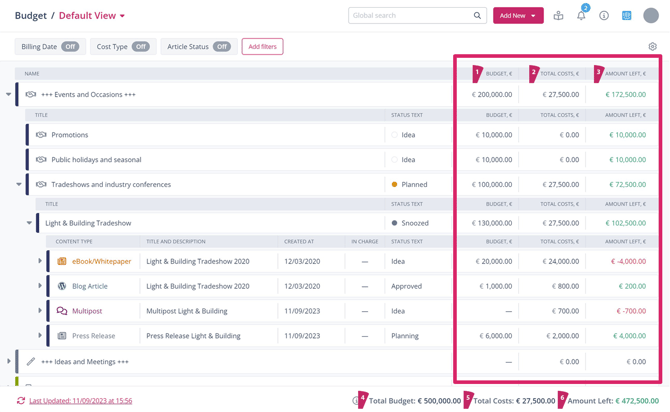
In the table columns on the right hand, you can find the key figures that help you keep control of your budget. Next to the available budget (1) which you entered in the respective card, you can find the total costs (2) – the sum of all individual costs from all articles, stories and topics – as well as the amount left (3) – the discrepancy between the budget and the total costs on each level.
At the bottom, you can see the total budget for your project (4), the total costs (5), which are the combined values from the table for each category, and the amount left (6), which is the difference between these two.
Use the “Aggregated Plan” function to double-check your budget planning
You can enter separate budgets in the article, story, topic and category cards. The “Aggregated Plan” function helps you to check whether your planned budget for the next lower level exceeds the sum that has been planned at the level you are looking at.
FOR EXAMPLE: You want to check if the amount you have planned for the subordinate topics of the category named “Events and Occassions” corresponds with your planned budget for this category.
The aggregated plan sums up all amounts displayed on the topic level in the budget column (10,000 EUR + 10,000 EUR + 150,000 EUR = 170,000 EUR). Accordingly, the sum is displayed in the column “Aggregated Plan” at the category level.

When you look at the numbers in the "Aggregated Plan" column (170,000 EUR) and the "Budget" column (200,000 EUR) for the category, you can see that your planned budget for the category is more than what has been planned for the subordinated topics combined. This means there's still an amount left which can be planned within the topics of this category.

To turn on this function, open the settings by clicking on the cogwheel icon on the upper right side of the area and activate the toggle for “Show Aggregated Plan”.

Control the actual costs of your project
All individual costs entered at the article, story or topic level will be summed up and aggregated at the higher levels. At each level, the sum of the costs is displayed in the “Total Costs” column. The value of “Amount Left” indicates which amount is left after subtracting the total costs from the budget. Negative values will be highlighted in Red, whereas positive values will be displayed in Green.
FOR EXAMPLE: You want to know how much of the planned budget is left for your category “Events and Occassions”. At the category level, you can see that your planned budget is 200,000 EUR. The amount spent is shown in the column “Total costs” and equals 27,300 EUR. Therefore, the amount left is 172,700 EUR.

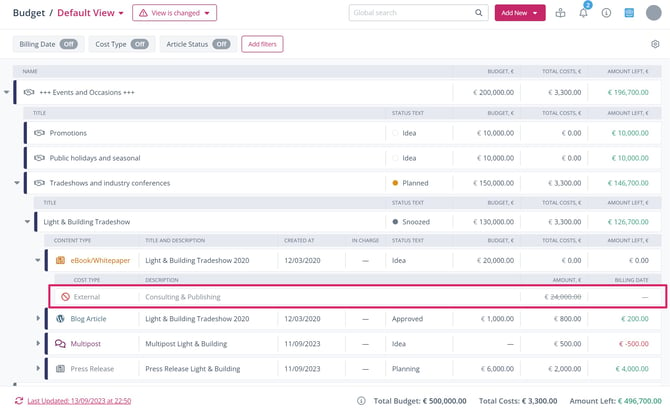
You can also display cancelled costs in the table. In order to do this, click the cogwheel icon on the upper right side of the area and activate the toggle for “Show Cancelled Costs”. The cancelled costs will then be displayed at the respective level with an icon, but will not be included in the count for total costs:
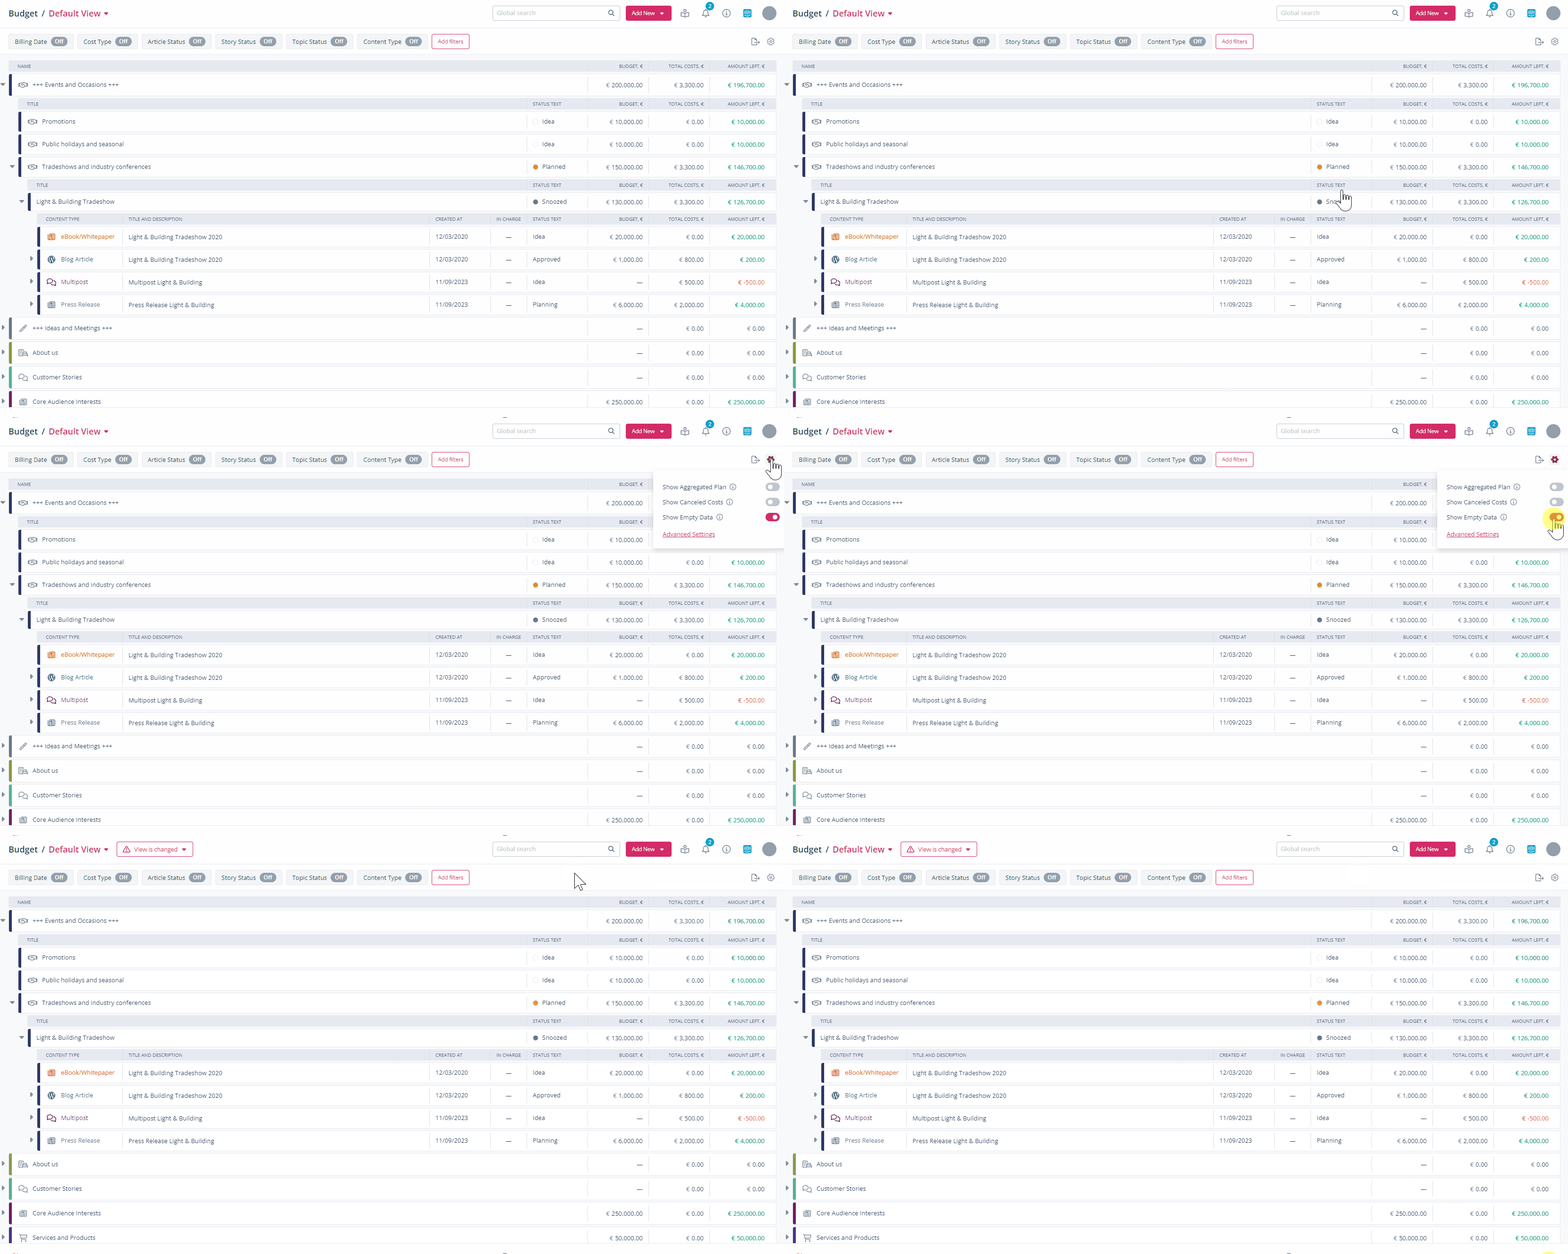
Another option available via the cogwheel icon is to hide rows in which no budget or no costs are entered for the respective category, topic, story or article. By default, the empty rows are displayed. If you want to hide them, deactivate the corresponding switch:
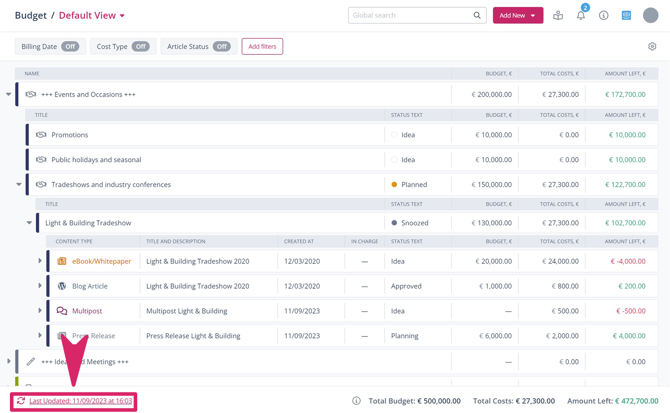
ATTENTION: Changes to the inserted data (e.g. newly added costs in an article card) may not appear automatically in the budget overview. Please use the status bar at the bottom of the page to check when the data was last updated.You can manually refresh the page at any time by clicking on the corresponding icon next to the last update time:
Use filters and create views for focused evaluations
In the budget overview, you can select various filters. Adapt the selection of filters to your needs using the "Add filter" button and select the options you want in each case. After applying a filter, the total costs, as well as the amount left, will be recalculated based on the current selection.
You can also add additional columns per level. Click on the cogwheel icon “Advanced Settings” in the upper right corner of your screen to select the columns that will be displayed at each level.
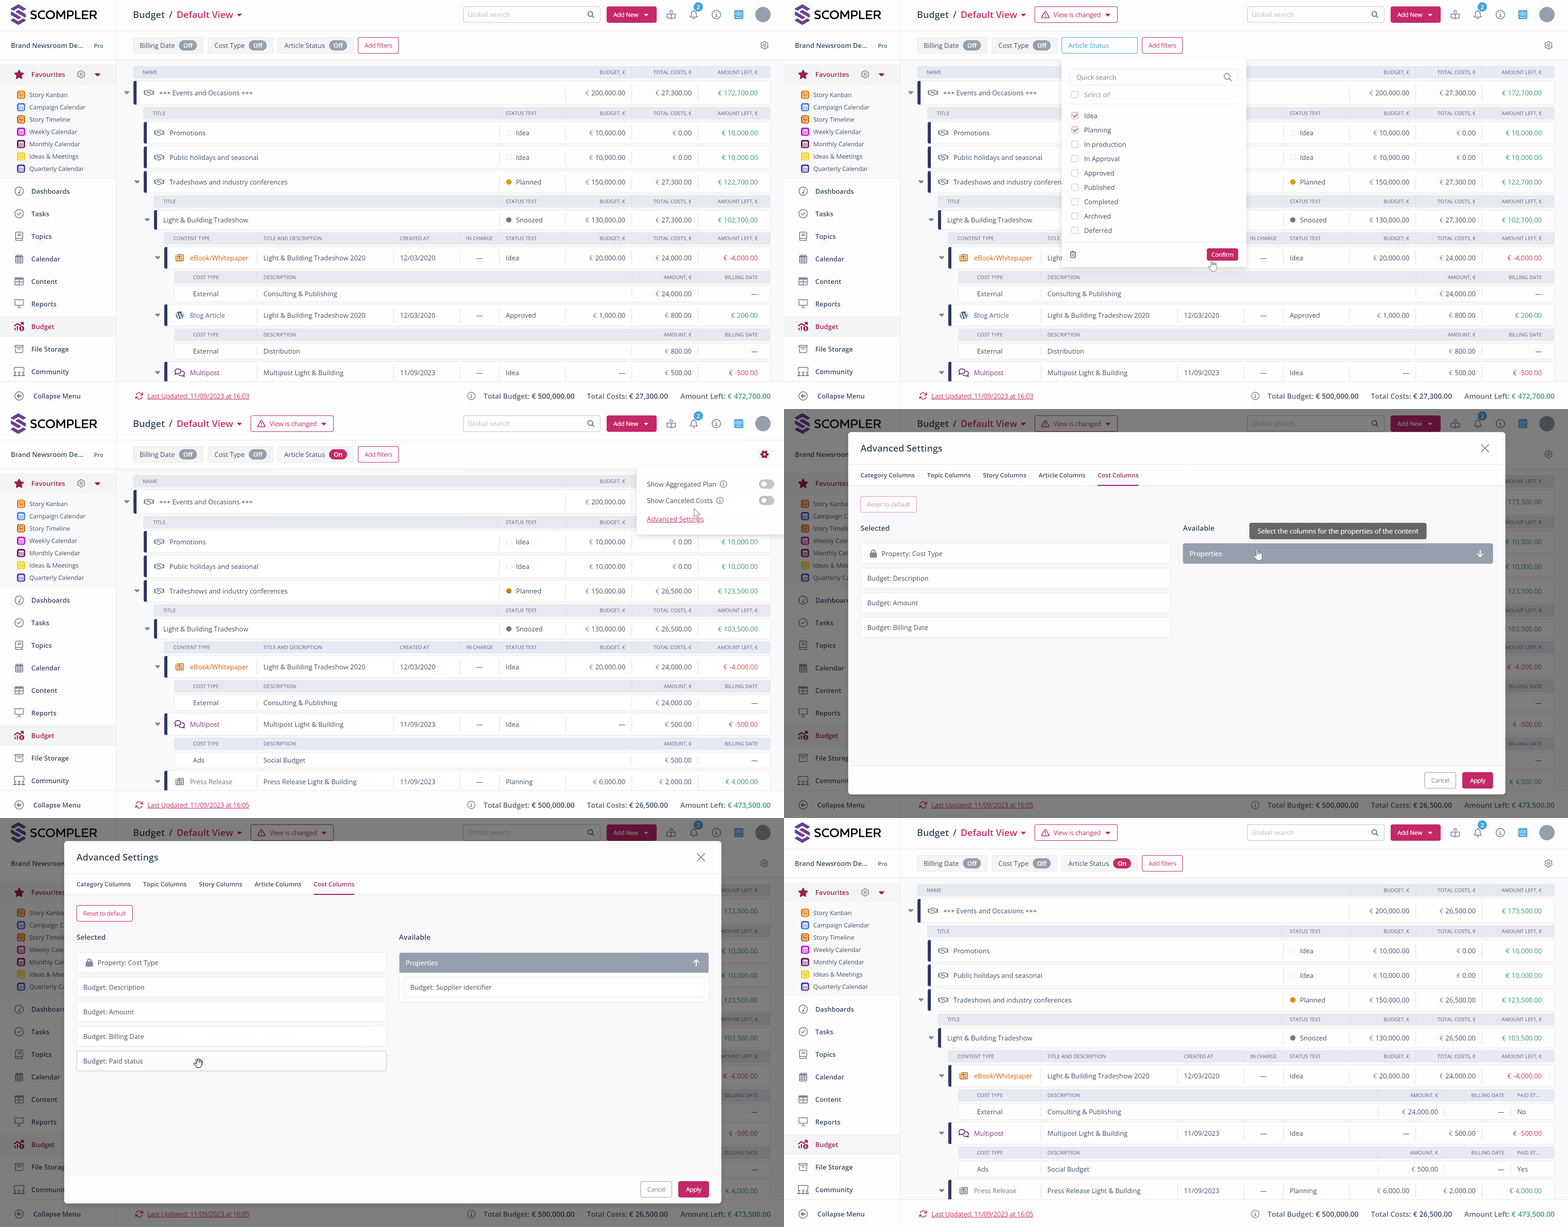
After applying new filters or adjusting settings, you might want to save your selection to the current view or save a new view. To do this, follow the steps in this article.
Export the budget overview
You also have the option of exporting the budget overview or a filtered view of it as a CSV or Excel document. To do so, select the export icon next to the cogwheel icon and choose the desired format.

NOTE FOR ADMINISTRATORS: Learn here how to activate the Budget feature for your project.
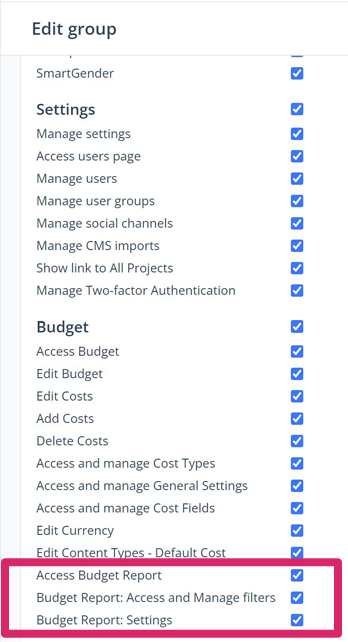
In order to grant your team members access to the Budget overview feature, activate the permission “Access Budget Report” in the “Budget” section of the user group settings. Below, you can specify whether a team member will be able to access and manage filters and settings on the site. Additionally, the permissions in the “Budget Report” section will manage access to the different views of the Budget overview.
