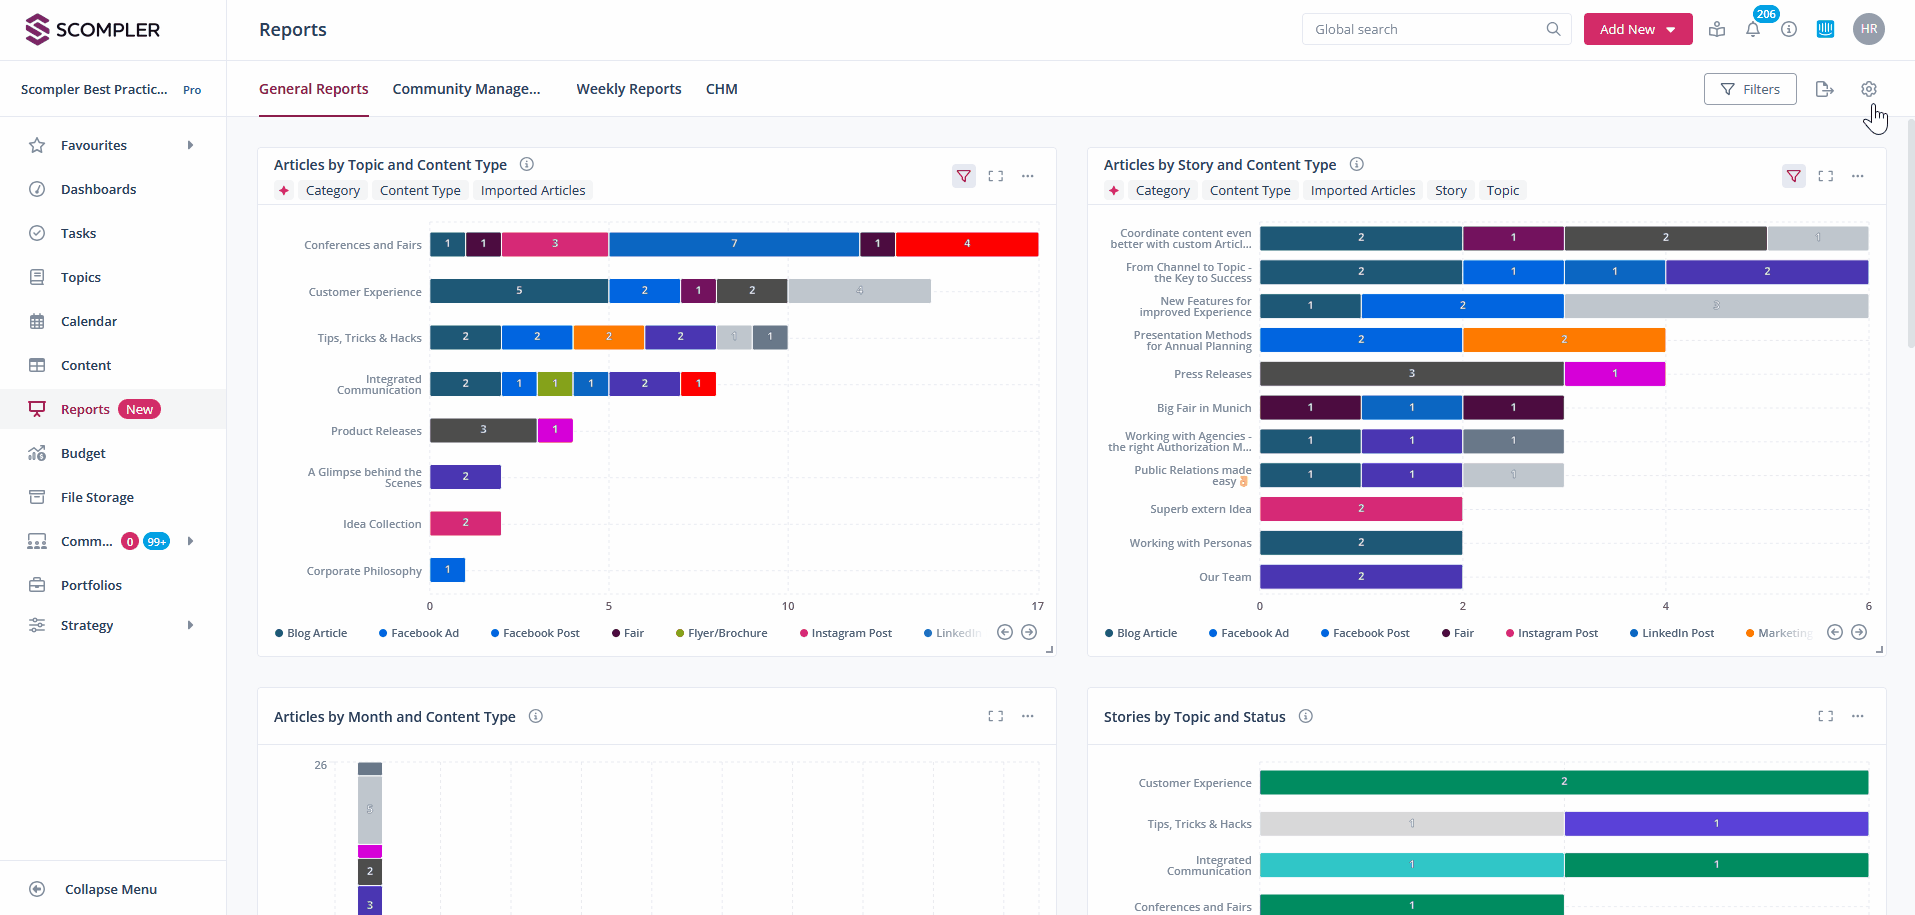
A good analysis of the planned and already communicated measures is the basis for a reliable evaluation and further planning. In the reports area, you can not only use various widgets to view your entire output quantitatively, but you can also answer specific questions in a targeted manner thanks to different perspectives and a wide range of filter functions.
Use multiple tabs as dashboards to explore individual topics or assess your strategic goals.
In this article, you will learn step by step how to set up your reports in Scompler:
Add and edit tabs
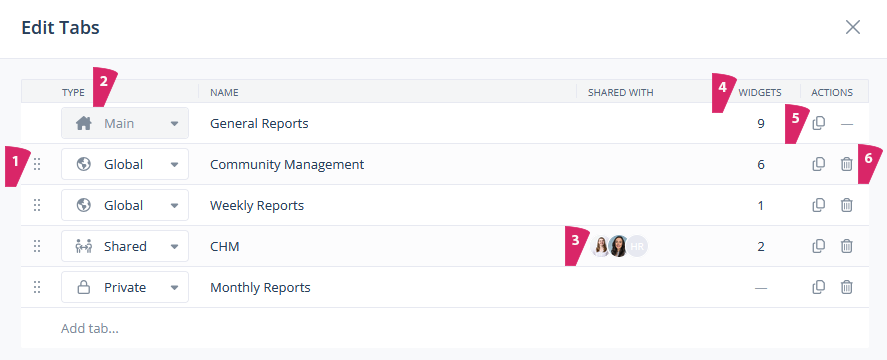
To create a new tab, navigate to the cogwheel in the top right-hand corner and click on “Edit tabs”. From here, select “Add tab”:
NOTE: Created tabs are automatically set to private and must first be set to “Global” or “Shared” in order to be shared with colleagues.
If you have several tabs, you can change the order of your tabs by simply dragging and dropping them (1). Under “Type”, you can set whether the tab is shared with everyone (Global), only with you (Private) or with a team or colleagues (Shared) (2). You can set the users with whom the tab is shared in the “Shared with” column (3). The current number of widgets for this tab can be found in the “Widgets” column (4). Tabs can be duplicated by clicking on the double document icon in the “Actions” column (5). Tabs that are no longer needed can be removed by clicking on the trash can icon (6).
Adding and editing widgets
Navigate to the cogwheel in the top right-hand corner and click on “Add new widget”. Here you can select and name widgets individually for evaluations at the article or story level, as well as for strategy parameters.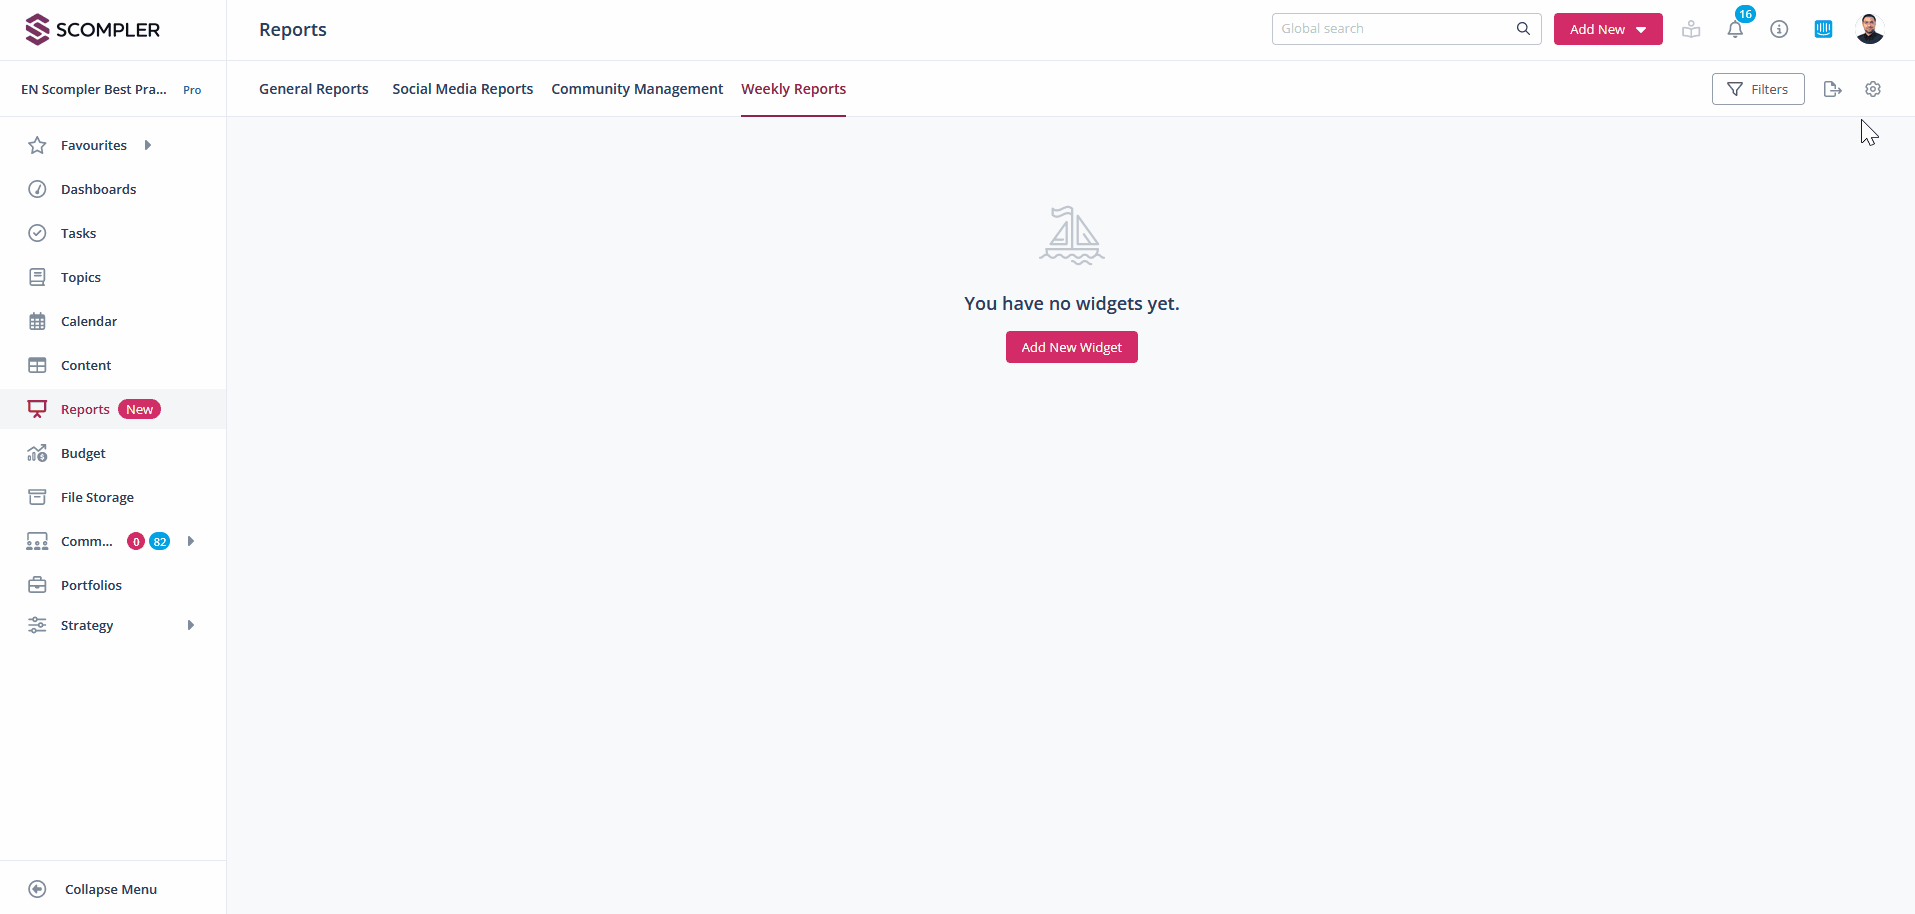
The “i” symbol provides you with information on the various widgets. The widgets can be moved as required and can be customized using filters. The size can also be adjusted by clicking and dragging the bottom right-hand corner of the widget. This is useful for displaying the rows under “More”.
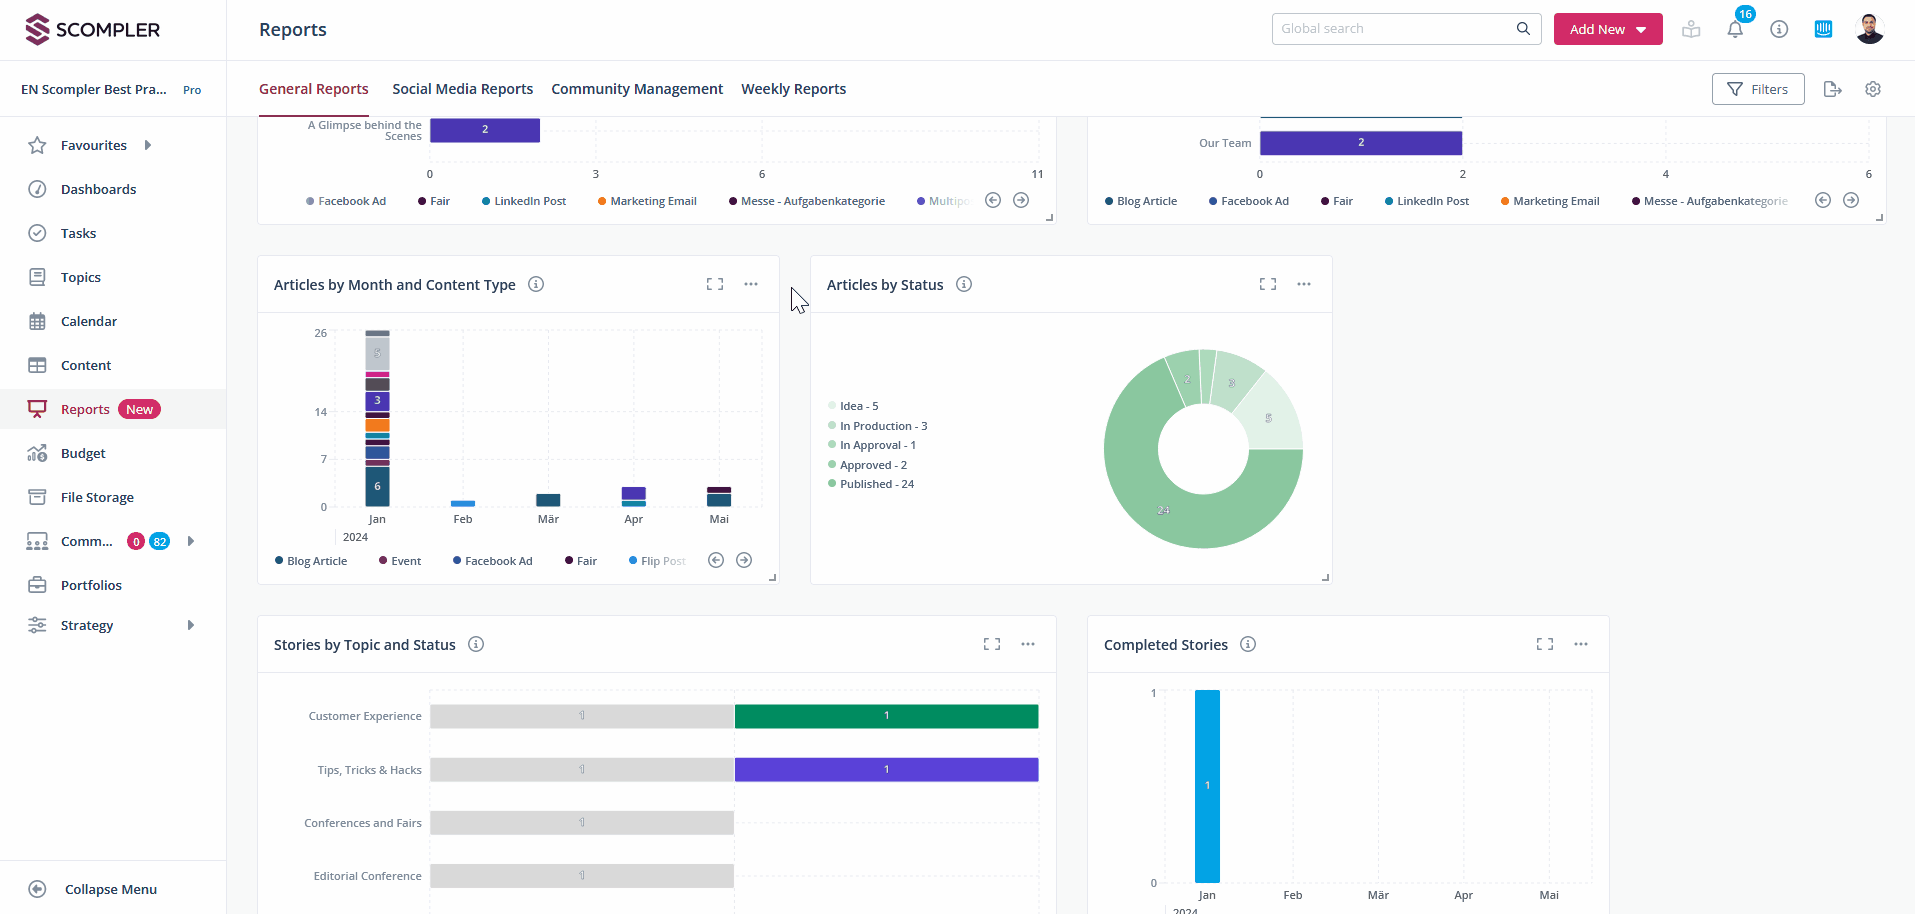
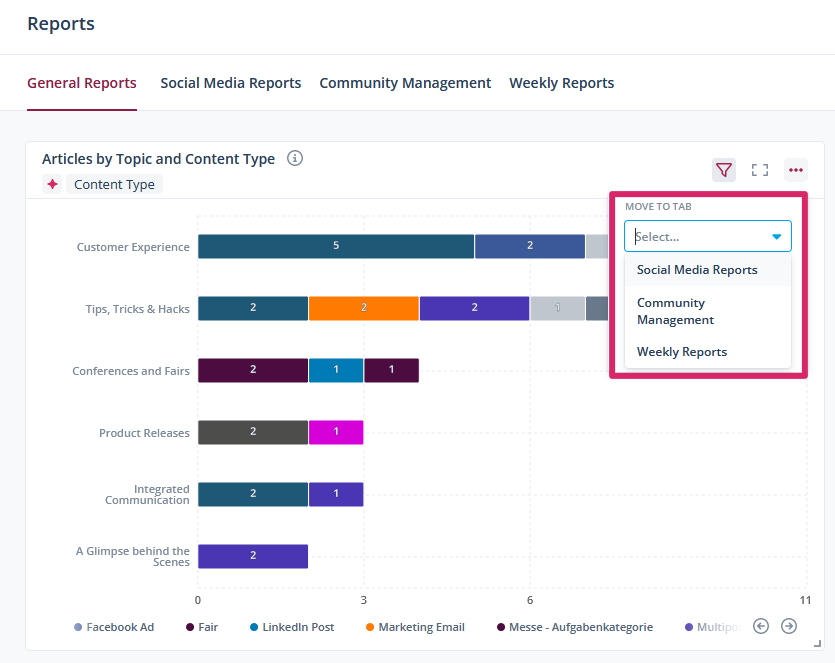
If you want to move widgets to other tabs, navigate to the three-dot menu of the respective widget and select the desired destination tab from the drop-down menu under “Move to tab”.
Here you also have the option of downloading the displayed widget information as an image in PNG format, as an Excel file or as a CSV file. To do this, select “Download” in the three-dot menu.
The different widget types explained
There are different widgets for analyzing articles, stories and the assigned strategy parameters. Bar and column charts are available for articles, which graphically display articles by topic, story, month and content types. The status of articles is displayed in a pie chart.
Stories can be displayed by topic and status in a bar chart. Completed stories over time are displayed in a bar chart.
The distribution of strategy parameters in articles or stories is displayed in a respective bar chart. Each of these widgets can display specific values using individual filters. Further information on widget filters and saving views can be found in this article.
Further information on the social media widget types can be found here.
If community management is activated in your project, the community widget types are also available to you. Here you can get an insight into the different widget types.
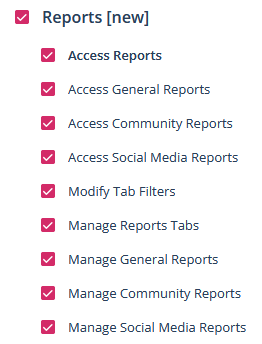
Note for administrators: For users to see saved views, the administrator must grant them access. Editing tab filters and managing tabs must also be enabled beforehand. Please also note that data from content a user does not have access to will not be displayed in their reports.